Agricultural Land & Water Use Estimates
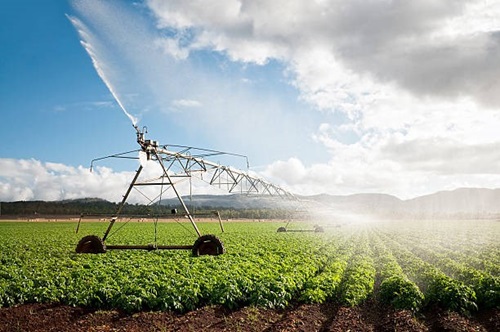
Crop Irrigation
We provide estimates of irrigated crop acreages, crop evapotranspiration (ETc), evapotranspiration of applied water (ETAW), effective precipitation (EP), and applied water (AW) for 20 crop categories each year. These values are estimated from reference evapotranspiration (ETo) or pan evaporation data (Ep), crop development over time (crop coefficients), soil characteristics, rooting depths, and the quantity and timing of precipitation. AW estimates include adjustments for irrigation efficiencies as well as the amount of water required for cultural practices, such as the ponding of water in rice fields or extra water applied to leach accumulated salts from the soil.
California is subdivided into study areas for planning purposes. The largest study areas are the 10 hydrologic regions (HRs) corresponding to the state's major drainage basins. The next level of delineation is the planning areas (PAs), which are composed of multiple detailed analysis units (DAUs). The DAUs are often split by county boundaries, so the smallest study area used by DWR is the DAU/county. Many planning studies begin at the DAU or PA level, and the results are aggregated into hydrologic regions for presentation.
Data compiled by study area (Statewide, Hydrologic Region (HR), Planning Area (PA), County, DAU, and DAU/County) and years are available for download as Zip file Excel Application tool in the California Natural Resources Agency (CNRA) open data source. To download data, click on any Zip file Excel Application tool for years of 1998-2005, 2006-2010, 2011-2015, & 2016-2020, and then click on download Zip file data for your years of interest.
To download data click on a year and select "Download.”
Agricultural Water Use Data 2016-2020
Agricultural Water Use Data 2011-2015